ROAS Formula Explained: How to Calculate Return on Ad Spend (with Examples)
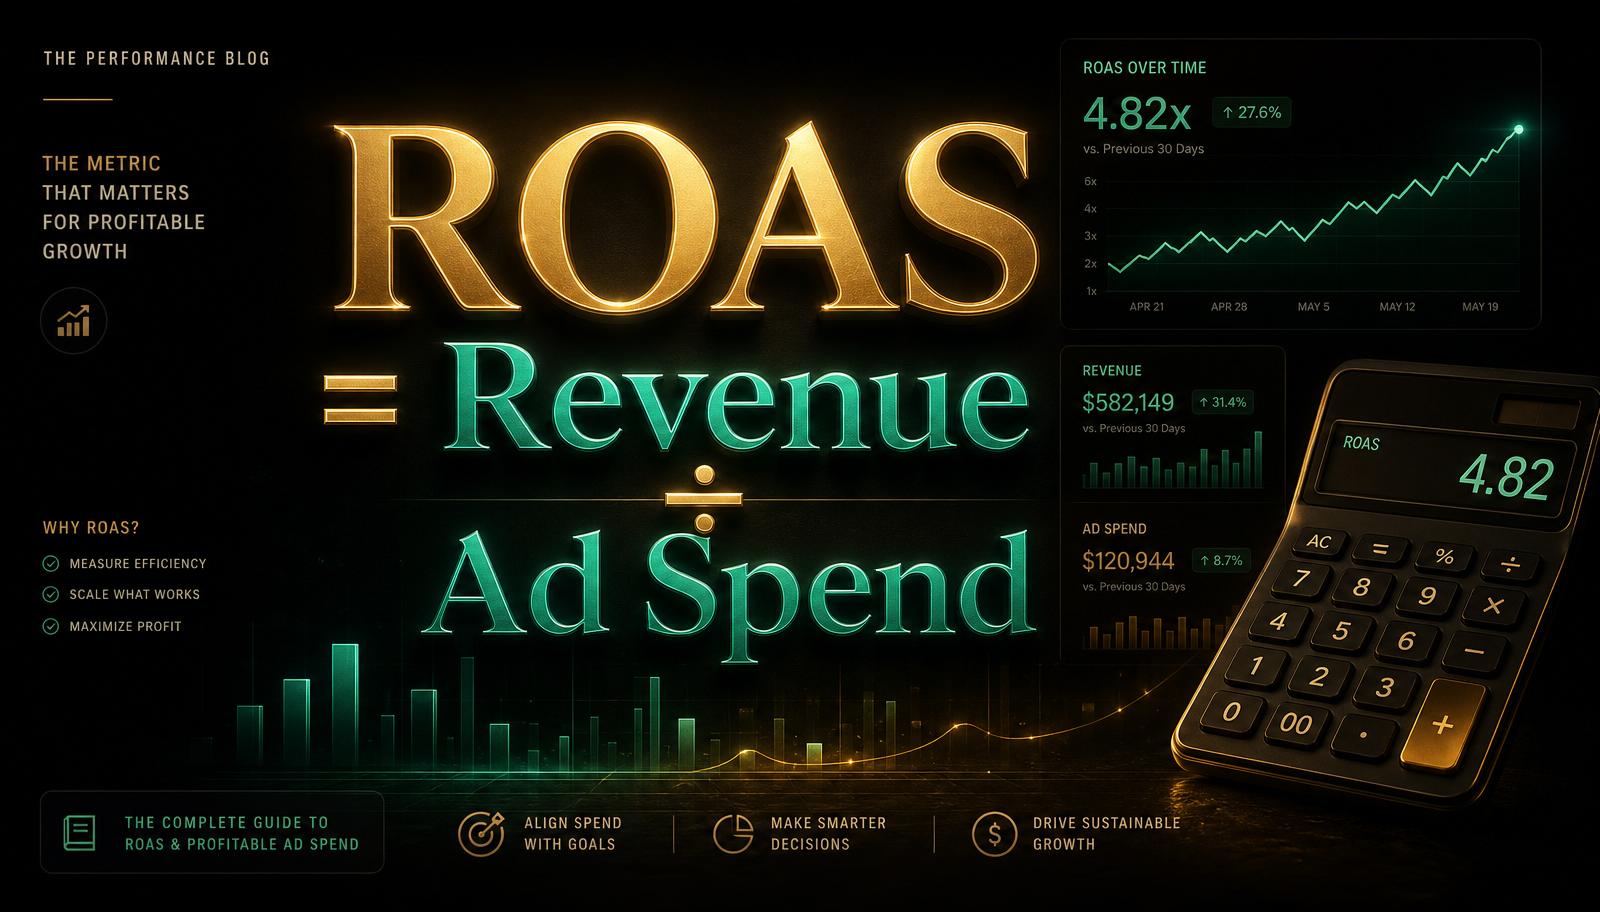
The ROAS formula is Revenue ÷ Ad Spend. Learn what counts as a good ROAS, how it differs from ROI, how to calculate break-even ROAS, and the exact levers to improve ROAS on Google Ads and Meta Ads.
We'll email you our Performance Marketing Setup Checklist instantly.
No spam. Unsubscribe anytime.
Knowing the ROAS formula is the easy part. Knowing what ROAS to target, when to trust the number, and how to actually improve it is what separates a junior media buyer from a performance marketer who gets hired for ₹12 LPA. This guide breaks it down with real numbers, then shows you the practical levers to move it.
The ROAS formula
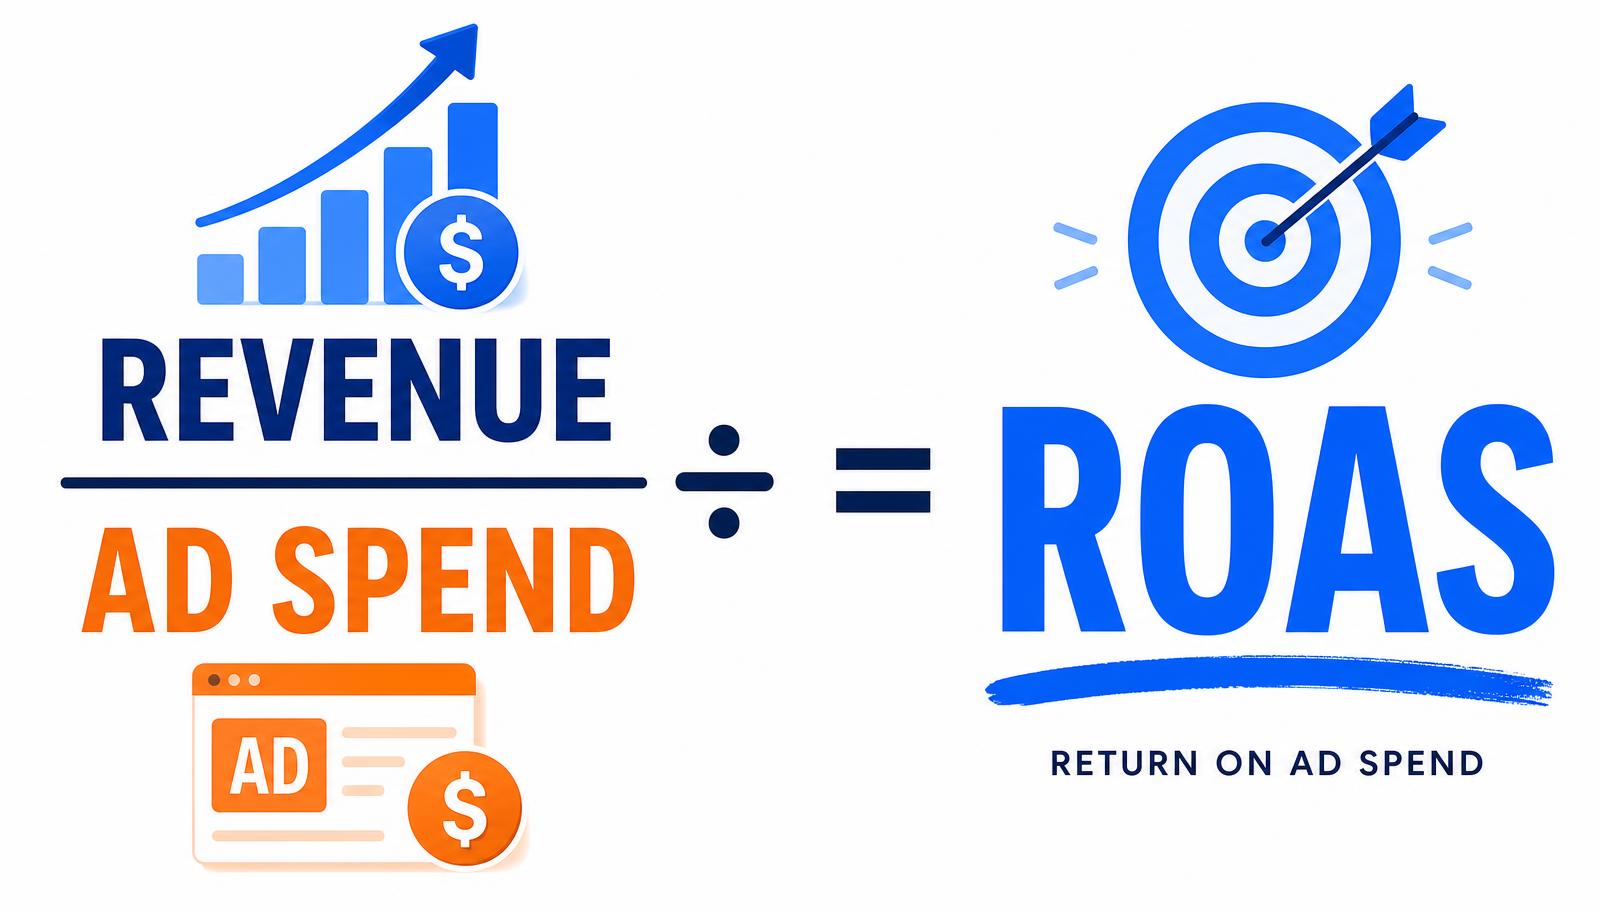
ROAS = Revenue from ads ÷ Cost of ads.
Or in plain English:
ROAS = the money you got out ÷ the money you put in.
Example. You spend ₹50,000 on a Meta Ads campaign for a D2C skincare brand. It generates ₹2,00,000 in tracked purchases.
ROAS = 2,00,000 ÷ 50,000 = 4
You'll see this written three ways — they all mean the same thing:
- 4 (as a decimal multiple)
- 4:1 (as a ratio)
- 400% (as a percentage)
Always report ROAS as a multiple (4.2), not a percentage (420%). Percentages look impressive to a founder but confuse the math when you're comparing against break-even.
ROAS vs ROI — don't confuse these
ROAS and ROI are related but they answer different questions:
| Metric | Formula | Answers |
|---|---|---|
| ROAS | Revenue ÷ Ad Spend | "How much revenue did my ads produce per rupee spent?" |
| ROI | (Profit − Total Cost) ÷ Total Cost | "Did the business make money after everything?" |
A campaign can have a great ROAS and terrible ROI if your product margin is thin, your fulfilment is expensive or your team overhead is high. That's why smart marketers report both — and why the ROAS bidding documentation from Google always frames ROAS as a proxy, not the final answer.
Break-even ROAS: the number that actually matters
Before you obsess over hitting "10x ROAS", calculate your break-even ROAS — the point where you're neither making nor losing money.
Break-even ROAS = 1 ÷ Gross Margin.
Example. You sell a ₹1,000 product with 40% gross margin (₹400 gross profit per sale after cost of goods, shipping and payment gateway).
Break-even ROAS = 1 ÷ 0.40 = 2.5
Anything above 2.5x ROAS makes money. Anything below loses money. Publishing this number on the wall next to your marketer's desk is the single highest-leverage thing you can do as a founder.
Quick break-even reference
| Gross Margin | Break-even ROAS |
|---|---|
| 20% | 5.0x |
| 30% | 3.33x |
| 40% | 2.5x |
| 50% | 2.0x |
| 60% | 1.67x |
| 70% | 1.43x |
What's a "good" ROAS?
There is no universal answer — it depends entirely on your margins and business model. But here are realistic benchmarks based on real Indian D2C and SaaS accounts we work with:
- Ecommerce (D2C) — 3–5x on prospecting, 5–10x on remarketing.
- Subscription / SaaS — 1–2x on first purchase is fine if LTV is high (₹2K MRR × 18-month retention = ₹36K LTV).
- Lead generation — agencies track pipeline ROAS (closed revenue ÷ ad spend), typically 5–10x.
- High-ticket coaching / courses — 3–4x is healthy given long sales cycles.
If someone tells you "10x ROAS is the goal for every business", they're selling you a course, not advice. The right target is your break-even ROAS plus a healthy margin.
The three ways to improve ROAS
There are only three levers. Every "ROAS optimisation" tactic maps to one of them.
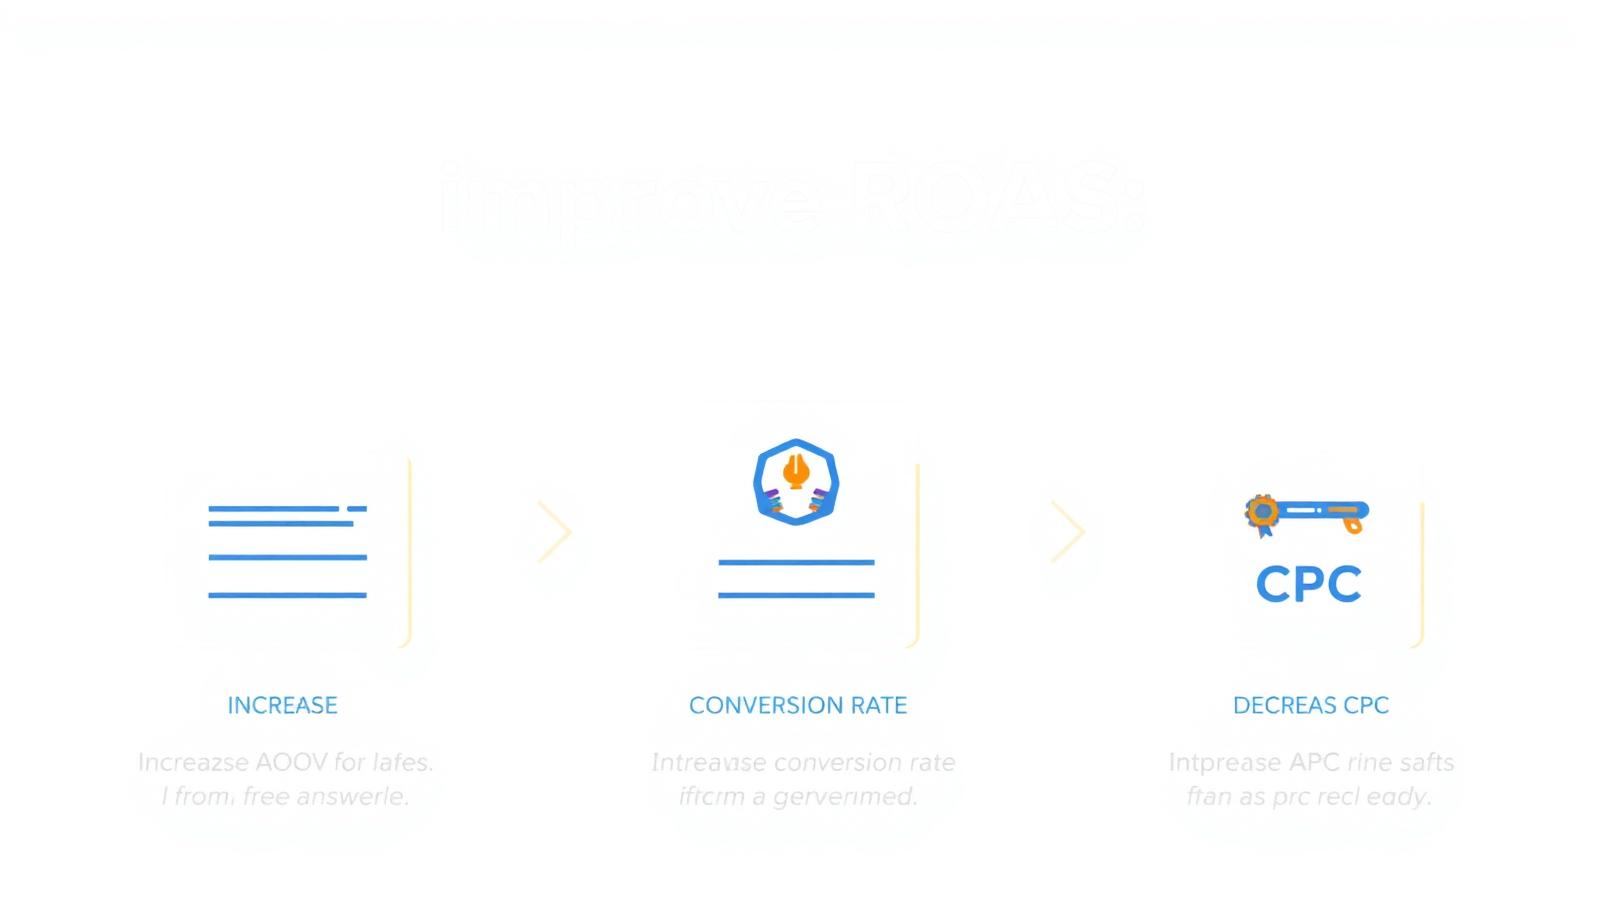
1. Increase Average Order Value (AOV)
Revenue per conversion goes up, so ROAS goes up — even if nothing else changes.
- Bundle offers ("buy 2 get 15% off")
- Free shipping thresholds ("free shipping over ₹1,499")
- Upsells at checkout (via Shopify apps like ReConvert or Bold Upsell)
- Better product mix in ads (feature higher-margin SKUs)
2. Increase Conversion Rate (CVR)
More sales from the same clicks = higher ROAS.
- Faster, mobile-first landing pages (target < 2.5s LCP on PageSpeed Insights)
- Trust signals (reviews, ratings, badges, delivery guarantees)
- Simpler checkout (one-page, guest checkout, Indian UPI)
- Match ad creative to landing page (message consistency)
3. Decrease Cost Per Click (CPC)
Same conversions, less spend = higher ROAS.
- Better Quality Score on Google (relevance, CTR, landing page)
- Better creative on Meta (thumb-stop ratio, hook in first 3 seconds)
- Negative keywords to cut waste (this alone recovers 10–20% of spend in most accounts)
- Dayparting and geo-targeting to focus budget
Where ROAS lies to you
ROAS looks like objective truth. It isn't. Watch out for:
- Attribution windows. Facebook's 7-day click, Google's data-driven — same purchase, both platforms claim it.
- View-through conversions. Someone saw your ad, never clicked, and bought a week later. Meta will report it as ROAS. Reality is fuzzier.
- Broken tracking. If your Conversions API or Enhanced Conversions are broken, ROAS is under-reported by 20–40%. Fix tracking before you cut a "losing" campaign.
- Brand vs non-brand blur. Search campaigns bidding on your own brand name look like heroes. They're often stealing organic traffic that would have converted anyway.
Before optimising a "poor ROAS" campaign, verify tracking. Fire a test purchase and confirm the event appears in both platform Ads Manager and GA4 within 30 minutes. Broken tracking is the single most common cause of false-negative ROAS reads.
This is why the performance marketing course at PMAcademy spends an entire week on tracking — GTM, GA4, server-side events, CAPI, Enhanced Conversions. Without clean data, every ROAS conversation is fiction.
ROAS calculator (do this now)
Grab a calculator and answer three questions about your business:
- What did I spend on paid ads last month?
- What revenue did those ads generate (per your ad platform report)?
- What's my gross margin per sale?
Then compute:
- ROAS = Q2 ÷ Q1
- Break-even ROAS = 1 ÷ Q3
- Gap = ROAS − Break-even ROAS
If gap is positive, scale spend by 20% and re-measure in 14 days. If gap is negative, fix creative, landing page or tracking before you spend another rupee.
From formula to career
Understanding the ROAS formula is table stakes. Actually using it to make ₹10 lakh/month campaigns profitable is a skill — and it's the exact skill Indian ecommerce brands, SaaS companies and agencies are hiring for right now.
Our performance marketing certification course covers ROAS optimisation across Google Ads and Meta Ads, with live client campaigns and 1-on-1 mentorship from a trainer with 15+ years in the industry. Also read: What is Performance Marketing? A Beginner's Guide, our complete guide to conversion tracking in performance marketing, CPA marketing explained for the cost-per-action side of the same maths, and the performance marketing interview questions that test this exact maths.
Join the free masterclass on 2nd October to see how the course runs.
Glossary
- ROAS (Return on Ad Spend)
- Revenue generated by ads ÷ ad spend. A media-efficiency metric expressed as a multiple, ratio or percentage.
- ROI (Return on Investment)
- (Profit − total cost) ÷ total cost. A business-level metric that accounts for product cost, fulfilment, salaries and platform fees.
- Break-even ROAS
- The ROAS below which a campaign loses money. Calculated as 1 ÷ gross margin.
- AOV (Average Order Value)
- Total revenue ÷ number of orders. Raising AOV mechanically raises ROAS with no other changes.
- CVR (Conversion Rate)
- Conversions ÷ clicks. Higher CVR means more sales from the same traffic, which raises ROAS.
- CPC (Cost Per Click)
- Total ad spend ÷ clicks. Lower CPC means cheaper traffic and higher ROAS on the same conversions.
- View-through conversion
- A conversion attributed to an ad the user saw but did not click. Inflates reported ROAS on Meta if attribution windows are long.
- Enhanced Conversions
- Google Ads feature that hashes and sends first-party data (email, phone) to improve conversion accuracy under iOS restrictions.
- Conversions API (CAPI)
- Meta's server-side tracking that sends conversion events directly from your server to Meta, recovering signal lost to iOS 14.5+ and ad blockers.
Sources & Further Reading
Frequently Asked Questions
What is the formula for ROAS?+
ROAS = Revenue from ads ÷ Cost of ads. If a Google Ads campaign spent ₹10,000 and generated ₹40,000 in revenue, ROAS is 4 (often written as 4:1 or 400%).
What is a good ROAS?+
A good ROAS depends on your margins. Ecommerce brands typically target 3–5x, subscription businesses aim for 2x+ on first purchase and profit on repeat orders, and lead-gen agencies use pipeline ROAS of 5–10x. Anything below your break-even ROAS (1 ÷ margin) is losing money.
What is the difference between ROAS and ROI?+
ROAS measures revenue against ad spend only. ROI measures profit against total cost — ad spend plus product cost, platform fees, salaries, tools. ROAS is a media metric; ROI is a business metric.
How do I improve my ROAS?+
Improve one of three levers: raise average order value (bundles, thresholds, upsells), raise conversion rate (better landing pages, trust signals, faster mobile), or lower CPC (Quality Score, negative keywords, better creative). Fix tracking first (Enhanced Conversions, Conversions API) so the algorithm optimises on real data.
Why is my reported ROAS different across Google Ads, Meta Ads and GA4?+
Each platform uses its own attribution window and model. Meta claims view-through conversions Google won't; Google's data-driven attribution splits credit differently from GA4's last-click. Pick one source of truth (usually GA4 or a data warehouse) for business reporting and use platform ROAS only for in-platform optimisation.
What is a good ROAS for Google Ads vs Meta Ads?+
Google Search ROAS is usually higher (4–8x for D2C) because intent is higher. Meta prospecting ROAS often sits at 2–4x with retargeting pushing 5–10x. Both should exceed your break-even ROAS after accounting for tracking gaps.
Join our live training program and become a performance marketing professional.
Instant-download resources from the PMAcademy shop that pair with this guide.